Flux · Flux.1 dev
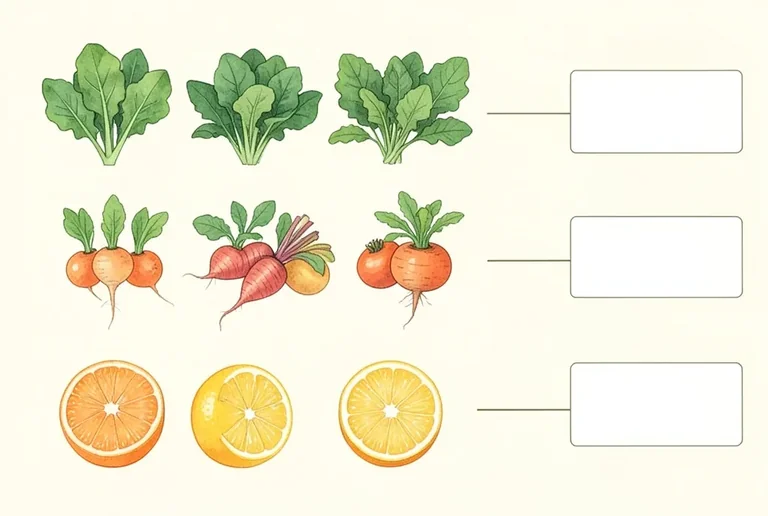
Food Nutrition Comparison Chart
Tested: 2026-08-08
3:2 · 768 × 516
The prompt
Prompt
A food nutrition comparison chart, a clean educational infographic showing three rows of whole foods arranged by category — a row of leafy greens, a row of root vegetables, and a row of citrus fruits — each food item rendered as a detailed botanical illustration in a neat grid, a thin connecting line from each food to a blank label box on the right side, flat vector art style with subtle watercolour texture, palette of fresh green, warm orange and soft yellow on a cream background, no text, no letters, no numbersHow to use this prompt
- 1
Open the generator that matches the model and version above, and start a new image rather than editing an existing one.
- 2
Set the output to 3:2 and apply the settings shown in the parameters panel — together those produced the 768 × 516 image on this page.
- 3
Paste the prompt exactly as written. Changing the wording changes the image, so copy it before you edit.
- 4
Generate, then change one thing at a time. The result will not be pixel-identical to the image on this page, because no seed is recorded for it.
Step count and CFG scale are recorded for this entry and belong to the sampler settings of whatever interface you run Flux in. No sampler name is recorded for Flux entries in this library, so there is nothing to match there.
Related prompts
More prompts from the same model, and prompts that share a use case with this one.